✦ Aurora Forecast AI

Northern Lights Map: Live Aurora Oval Tonight

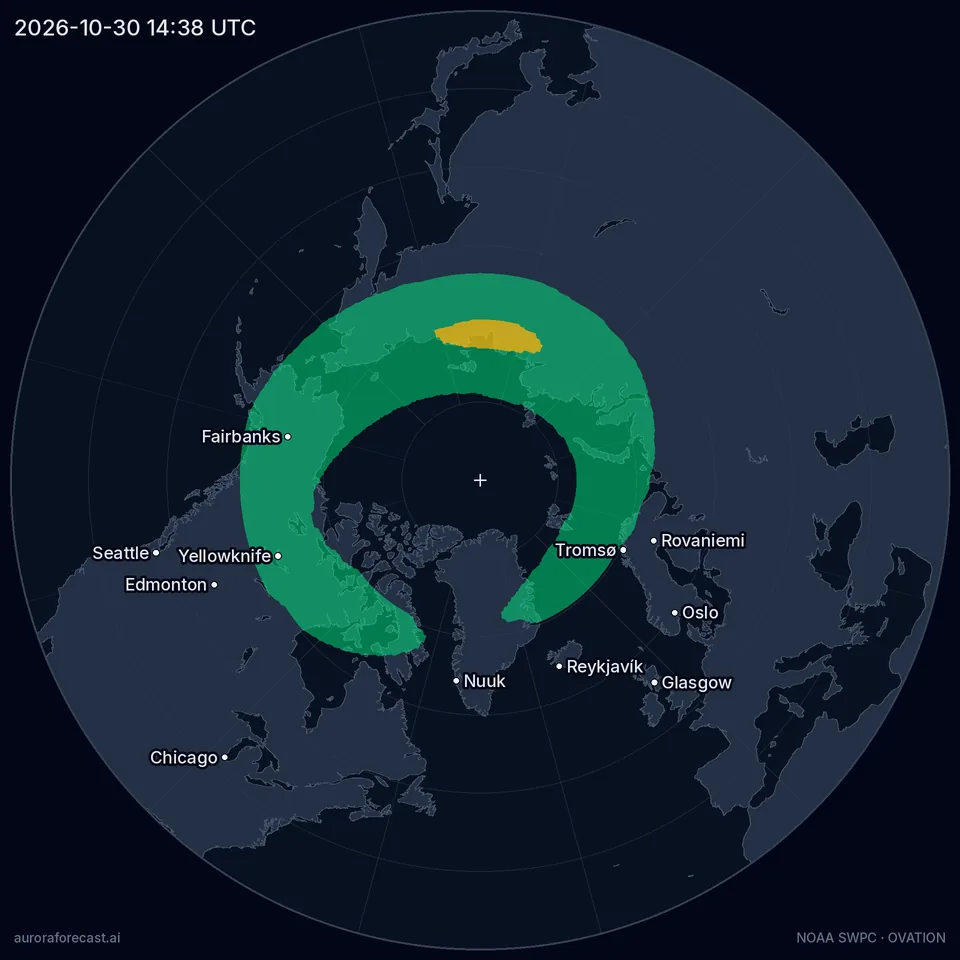
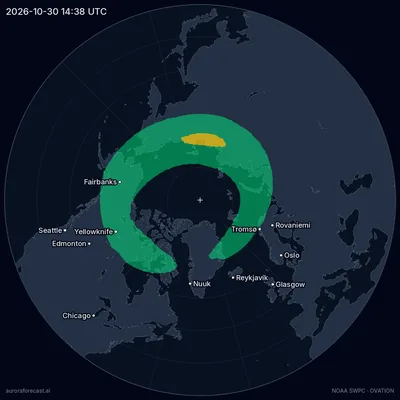
Northern lights oval map, 2026-10-30 14:38 UTC — Quiet activity, Kp 1.7
NOAA OVATION forecast for 14:38 UTC, from the solar wind measured at 13:17 UTC.
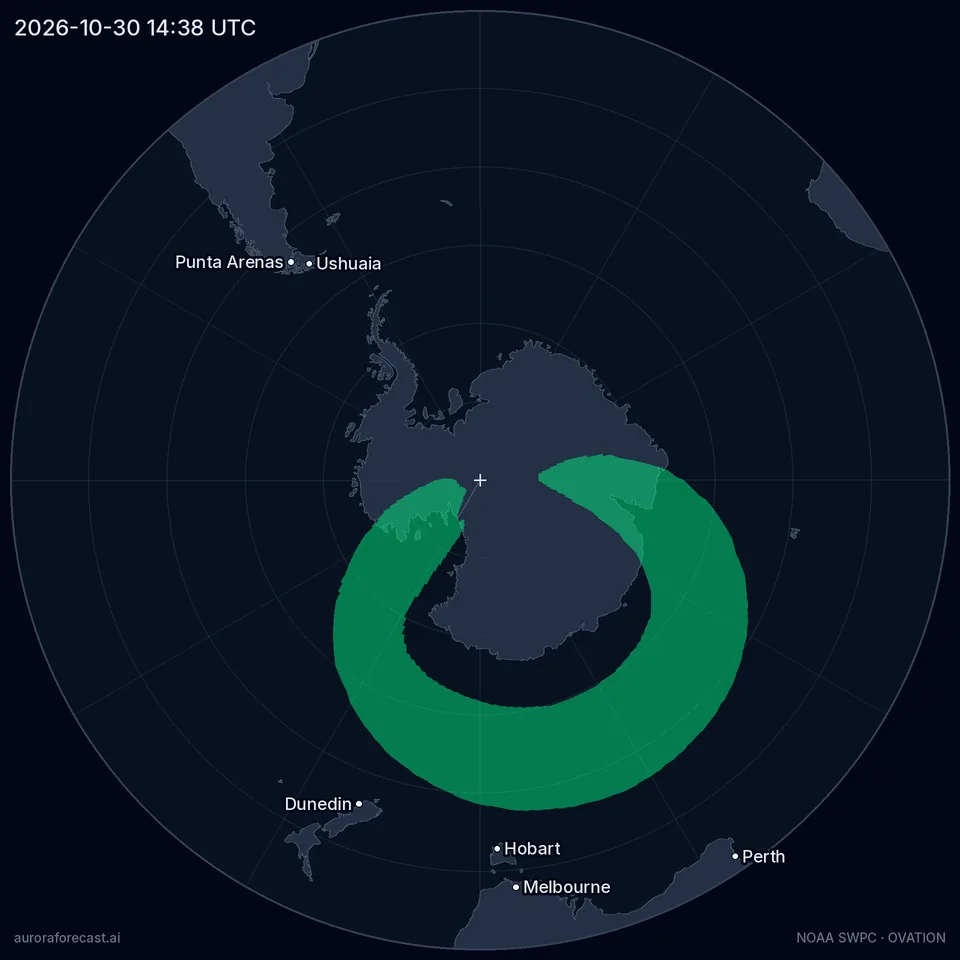
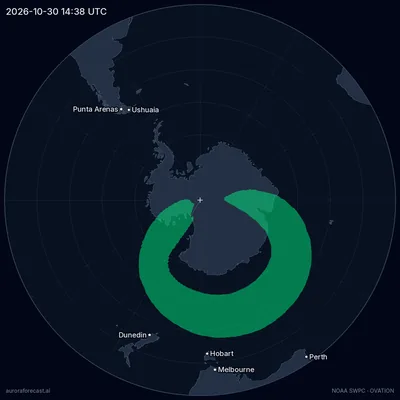
Southern lights oval map, 2026-10-30 14:38 UTC — Quiet activity, Kp 1.7
NOAA OVATION forecast for 14:38 UTC, from the solar wind measured at 13:17 UTC.

Aurora oval probability

  • Moderate: 5–20% probability — aurora possible.
  • Elevated: 20–40% probability — aurora likely if skies are clear.
  • High: Over 40% probability — aurora very likely overhead.

What the map shows right now

Right now: Quiet activity, Kp 1.7. Highest probability among the places we track: Alaska (United States), Yukon (Canada), Finnmark (Norway), up to 15%.

Check a place

The oval over the last 3 hours

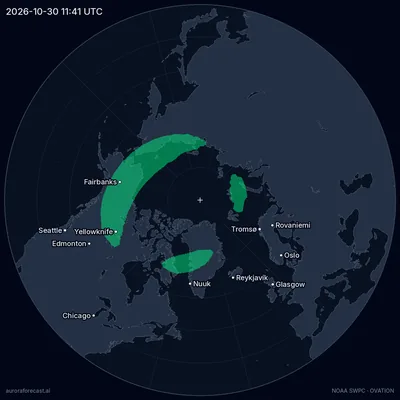
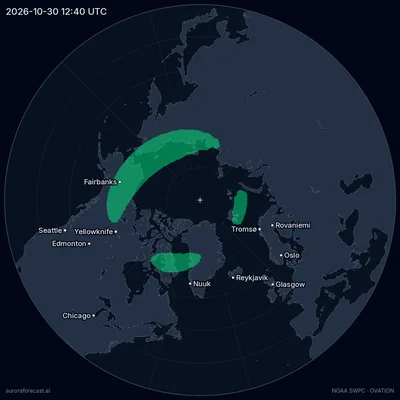
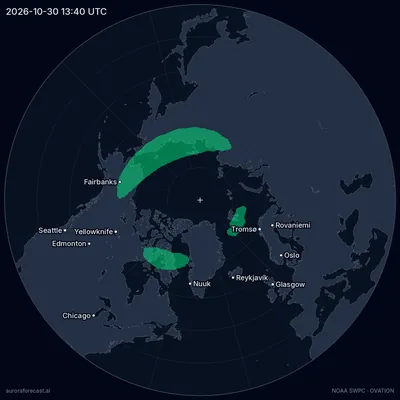
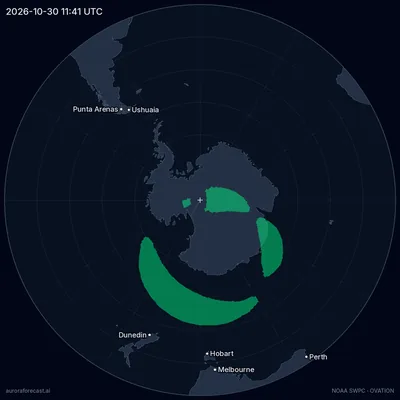
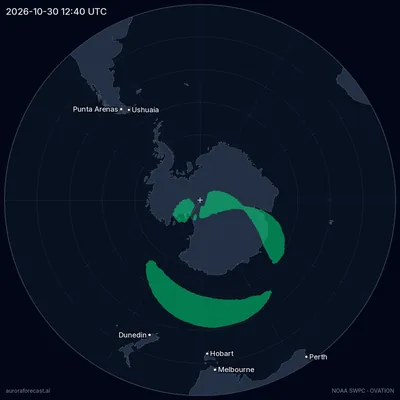
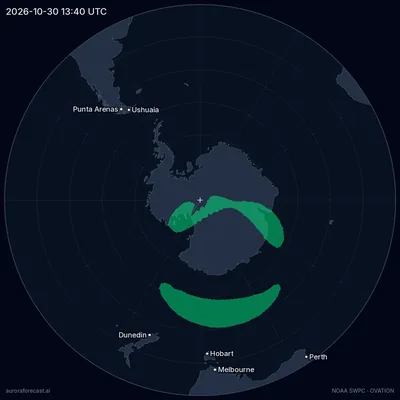
NOAA’s model looks 30 to 90 minutes ahead and no further. These are its frames of the last three hours: they show which way the oval is moving, not where it will be.

  1. Northern oval at 11:41 UTC
  2. Northern oval at 12:40 UTC
  3. Northern oval at 13:40 UTC
  4. Northern oval at 14:38 UTC
  1. Southern oval at 11:41 UTC
  2. Southern oval at 12:40 UTC
  3. Southern oval at 13:40 UTC
  4. Southern oval at 14:38 UTC

Aurora forecast by country

Source: NOAA SWPC — Aurora 30-Minute Forecast (OVATION)

How to read the aurora map

The colours are the chance of seeing aurora overhead at that spot within the next hour or so, as NOAA's OVATION model estimates it. The three bands are the levels our forecast pages use for the same number: 5–20% moderate, 20–40% elevated, 40% and over high. Below 5% the map stays empty.

The ring is the auroral oval, and it is centred on the geomagnetic pole, not the geographic one. That pole lies in the Canadian Arctic, so on the map the oval sits off-centre, shifted towards North America. The empty middle is the polar cap, where aurora is less frequent, not more.

The colour means aurora overhead. A bright display can be seen low on the poleward horizon from up to about 1000 km (600 miles) beyond the edge of the oval, so a place just outside the colour is not out of luck. How far depends on how bright it is, which is why the map draws no fixed "view line".

Clouds and daylight are not on the map: a colour over your town under overcast or at noon shows nothing. Search for your place above — next to its name you get the aurora probability near it, its cloud cover this hour and whether the sky is dark.

How far ahead the map looks

The model looks 30 to 90 minutes ahead: that is how long the solar wind measured at the L1 point, 1.6 million km (1 million miles) upstream, takes to reach Earth. We fetch NOAA's new frame every 15 minutes. The frames of the last three hours show which way the oval is moving; they are not a forecast of the next three.

For this evening rather than the next hour, read the three-day Kp forecast and the ranking of places for tonight. A place's own forecast goes further than the map: its Aurora Score weighs the activity against that place's threshold and adds cloud cover, darkness and the moon — how the score is built. What a Kp number means at your latitude is in the Kp index guide.

Frequently asked questions

How accurate is the aurora map?

It is a good guide to the next hour, not a promise. NOAA's OVATION model looks 30 to 90 minutes ahead — as long as the solar wind takes from its monitor to Earth — and cannot see further. The colours are an estimated chance of aurora overhead, not a photograph of it. Clouds, daylight and the moon are not on the map, so check them for your place before you go out.

Why is the map different from the Kp?

They measure different things. Kp is one number for the whole planet and a three-hour block, taken from the disturbance of Earth's magnetic field, and it describes how large the auroral oval is. The map is built from the solar wind measured upstream of Earth, for the next hour, cell by cell. So it shows where around the oval the aurora is strongest right now, which one number cannot.

What is the OVATION model?

OVATION is the aurora model of NOAA's Space Weather Prediction Center. It starts from the solar wind — its speed and its magnetic field, measured 1.6 million km (1 million miles) upstream of Earth — and calculates how many charged particles are streaming into the upper atmosphere, which the aurora follows closely. That becomes a chance of seeing aurora at each point of a 1° grid. We fetch NOAA's grid every 15 minutes and draw it on this map.

Is there a map for the southern hemisphere?

Yes — switch to the southern hemisphere above the map: the same NOAA model covers both poles. The southern lights, aurora australis, are the same phenomenon as the northern lights, in a mirror-image auroral oval around the south geomagnetic pole, and the colours mean the same. They are seen from places such as Tasmania, southern New Zealand and the south of Chile and Argentina, usually low over the southern horizon — pick a dark spot with an open view to the south.

Related

Aurora Forecast AI Tracker

Never miss the Northern Lights

Download Aurora Forecast AI Tracker to follow your local Northern Lights forecast in real time. Save favorite aurora locations, check the best viewing window, track hourly cloud cover and Kp activity, and receive smart aurora alerts when conditions improve.

  • Smart aurora alerts
  • Best viewing window
  • Hourly forecast
  • Saved locations
Download Aurora Forecast AI Tracker on the App StoreGet Aurora Forecast AI Tracker on Google Play